Validate Trade Input Data
The validate R package developed at Statistics Netherlands offers a data validation infrastructure.
The validator function can read a set of rules from a text file
v <- validator(.file = "../extra/summary_complete_tf_cpc_esdata_tldata_rulesfile.yml")
The text file can follow a free form or a yaml format
# content of summary_complete_tf_cpc_esdata_tldata_rulesfile.yaml
rules:
-
  expr: weight > 0
  name: weight
  label: weight positivity
  description: |
   If the value is positive, weight should be positive as well.
-
  expr: "!is.na(qty)"
  name: qty
  label: qty exists
  description: |
    The qty should exist.
- see rule-files.Rmd for additional information on the format of rules files
- see intro.Rmd for additional examples using the validate package
A data.frame containing the variables qty and weight can be confronted with a validator v:
cf_esdata <- esdata %>% as.data.frame %>% confront(x = v)
cf_tldata <- tldata %>% as.data.frame %>% confront(x = v)
Inspecting the result of the confrontation
Methods have been created for objects returned from the confront function
- currently, only the data for 2011 is considered
- the result can be inspected with the summary function
- the result can be visualized using the barplot function
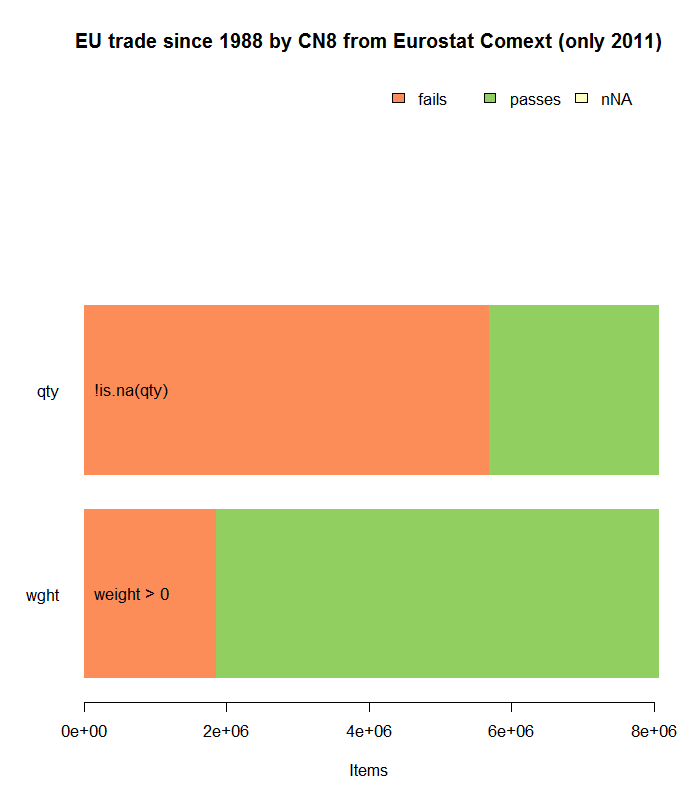
Summary EU trade since 1988 by CN8 from Eurostat Comext (only 2011)
complete_tf_cpc_esdata_tldata_sum$cf_esdata %>%
  summary
## rule items passes fails nNA error warning expression
## 1 weight 8077901 6224972 1852929 0 FALSE FALSE weight > 0
## 2 qty 8077901 2384306 5693595 0 FALSE FALSE !is.na(qty)complete_tf_cpc_esdata_tldata_sum$cf_esdata %>%
barplot(main = "EU trade since 1988 by CN8 from Eurostat Comext (only 2011)")
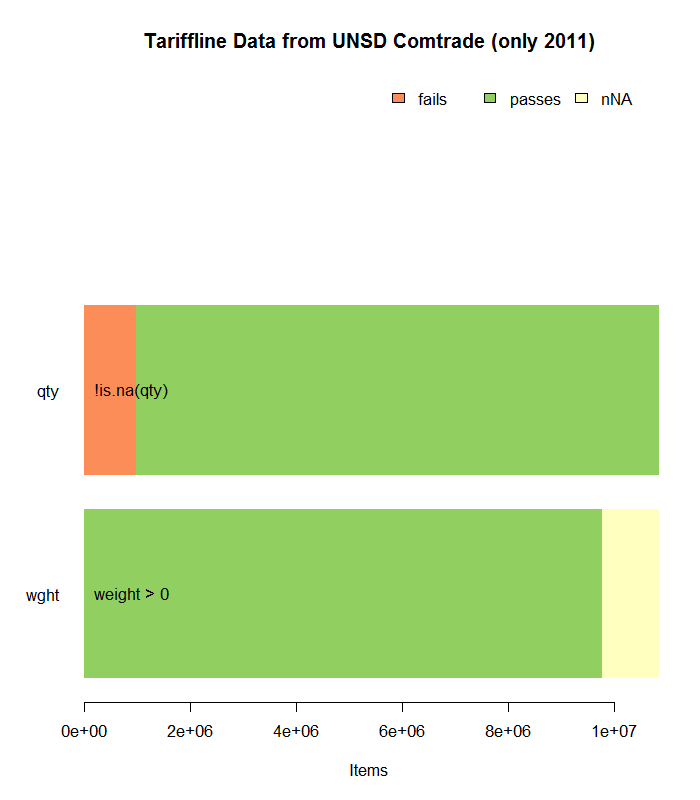
Summary Tariffline Data from UNSD Comtrade (only 2011)
complete_tf_cpc_esdata_tldata_sum$cf_tldata %>%
  summary
## rule items passes fails nNA error warning expression
## 1 weight 10850866 9769026 0 1081840 FALSE FALSE weight > 0
## 2 qty 10850866 9862034 988832 0 FALSE FALSE !is.na(qty)complete_tf_cpc_esdata_tldata_sum$cf_tldata %>%
barplot(main = "Tariffline Data from UNSD Comtrade (only 2011)")
Visualization and Imputation of Missing Values
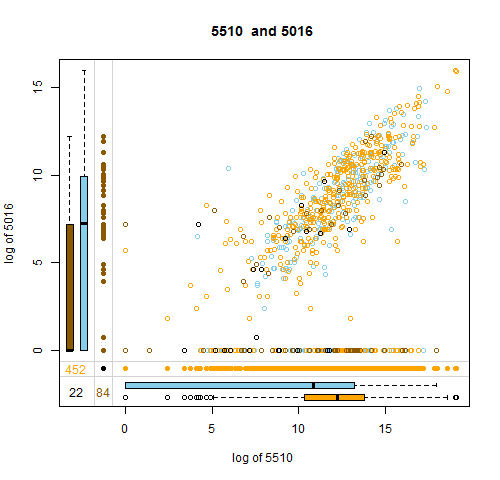
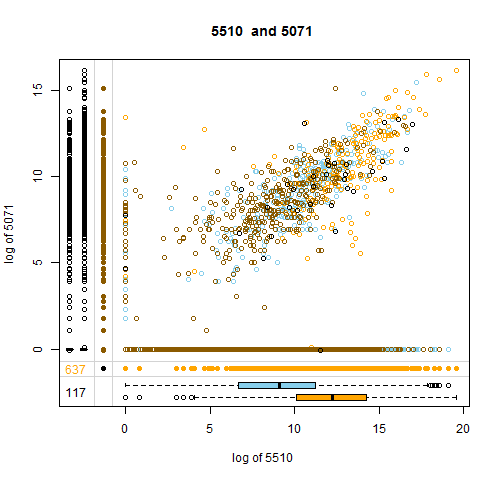
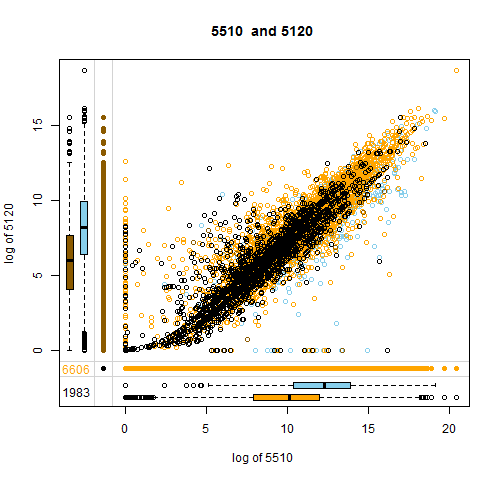
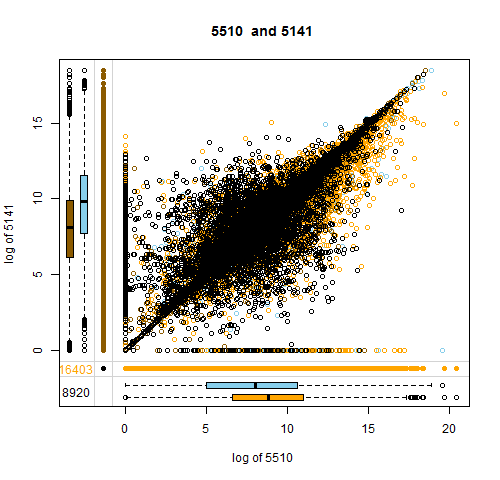
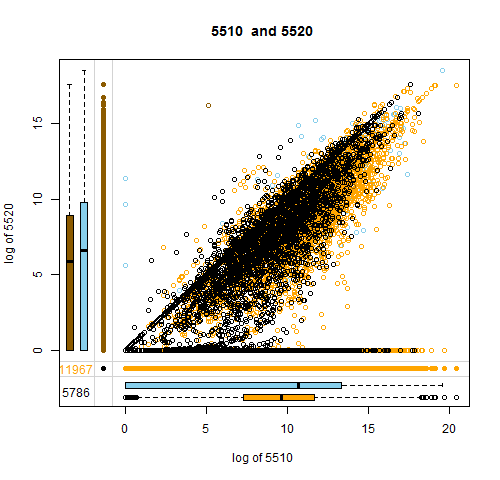
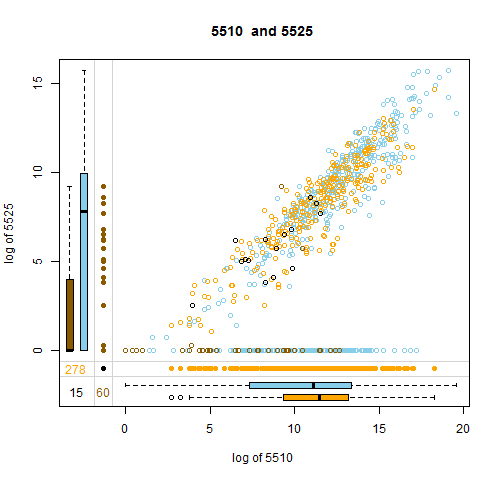
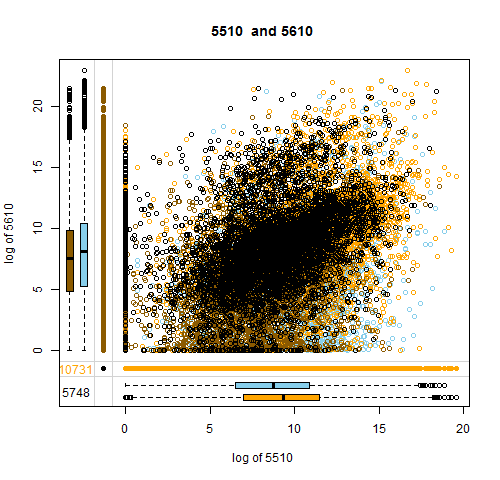
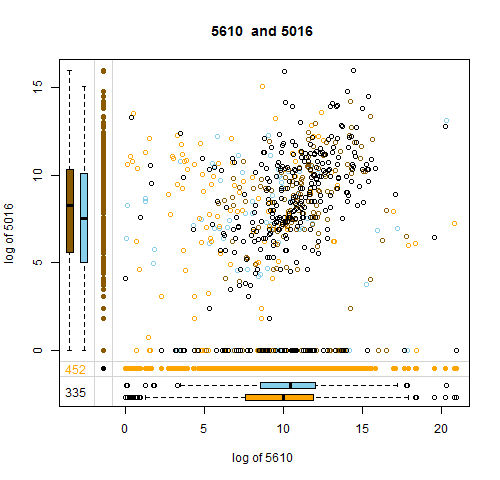
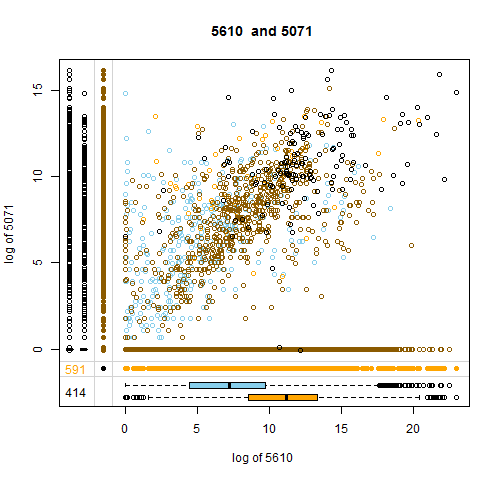
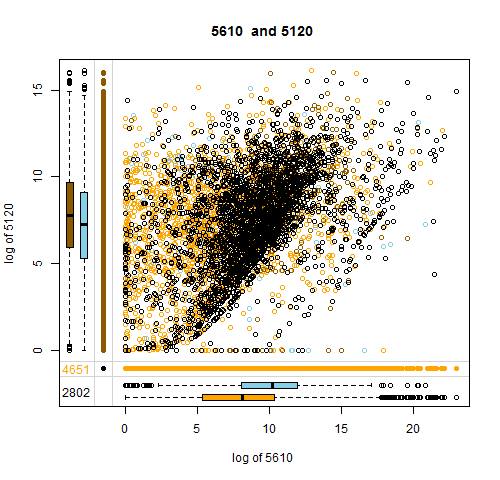
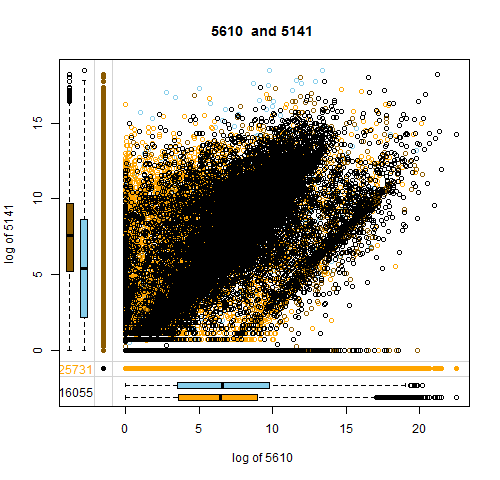
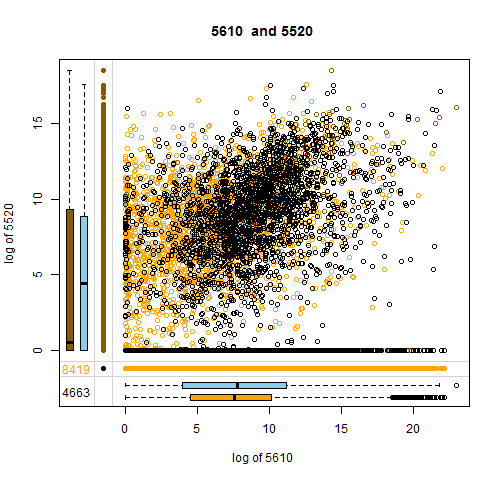
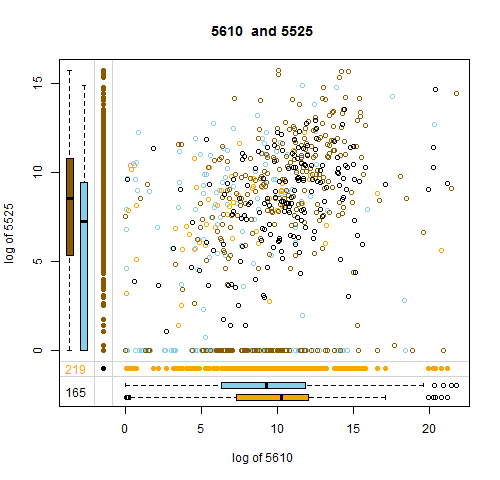
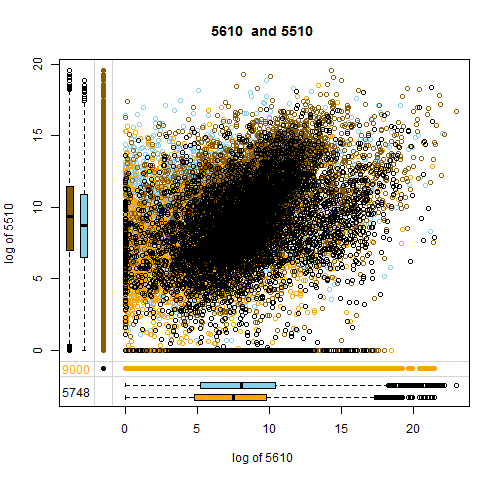
The quality of imputation can be visually explored using various univariate, bivariate, multiple and multivariate plot methods.
In addition to the scatterplot, boxplots for available and for imputed values, as well as univariate scatterplots for the imputed values are given in the plot margins. Furthermore the frequencies of imputed values are displayed, again for each variable.
- values highlighted with an orange color represent values of the first variable, which are imputed values in the second one
- dark orange colored values mark values of the second variable, which are imputed in the first one
- black color values are imputed in both variables
Production and other variables

Import Quantity and other variables
Input Data Validation

Dietary Energy Supply DES
Shared working folder B, C

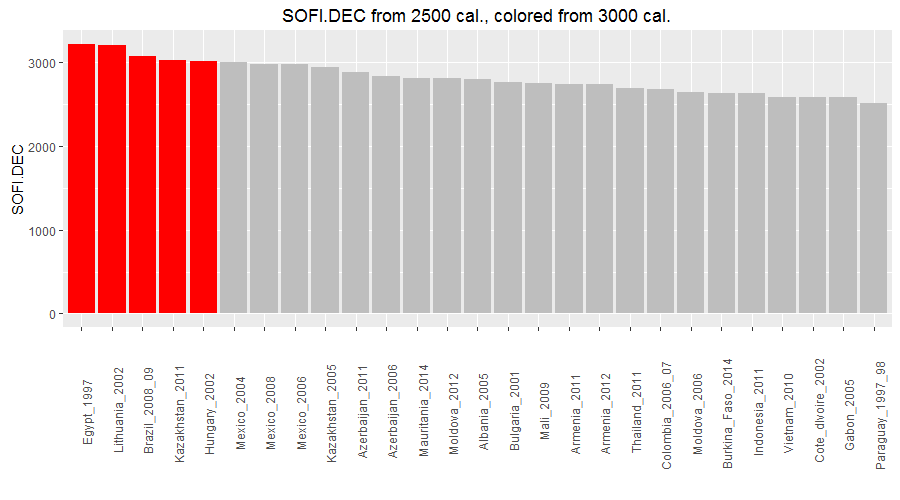
Comparison Dietary Energy Supply DES and Consumption DEC
Reconciliation between dietary energy consumption from FBS and NHS
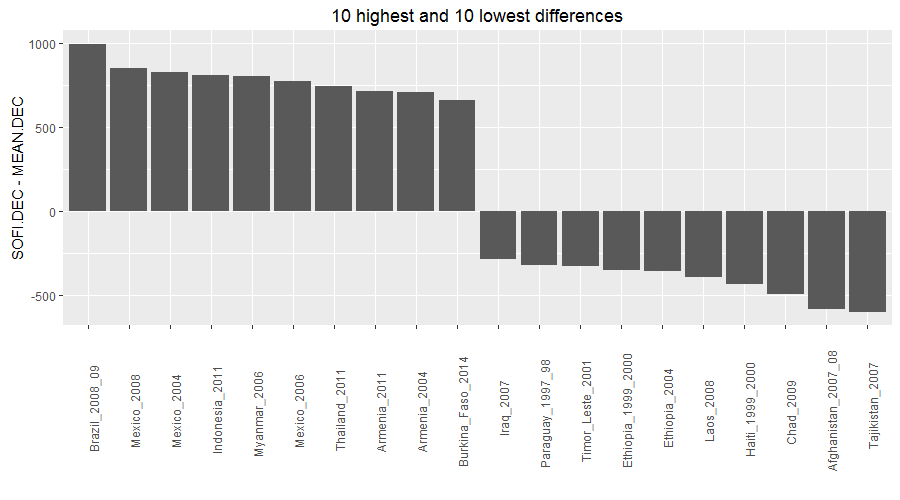
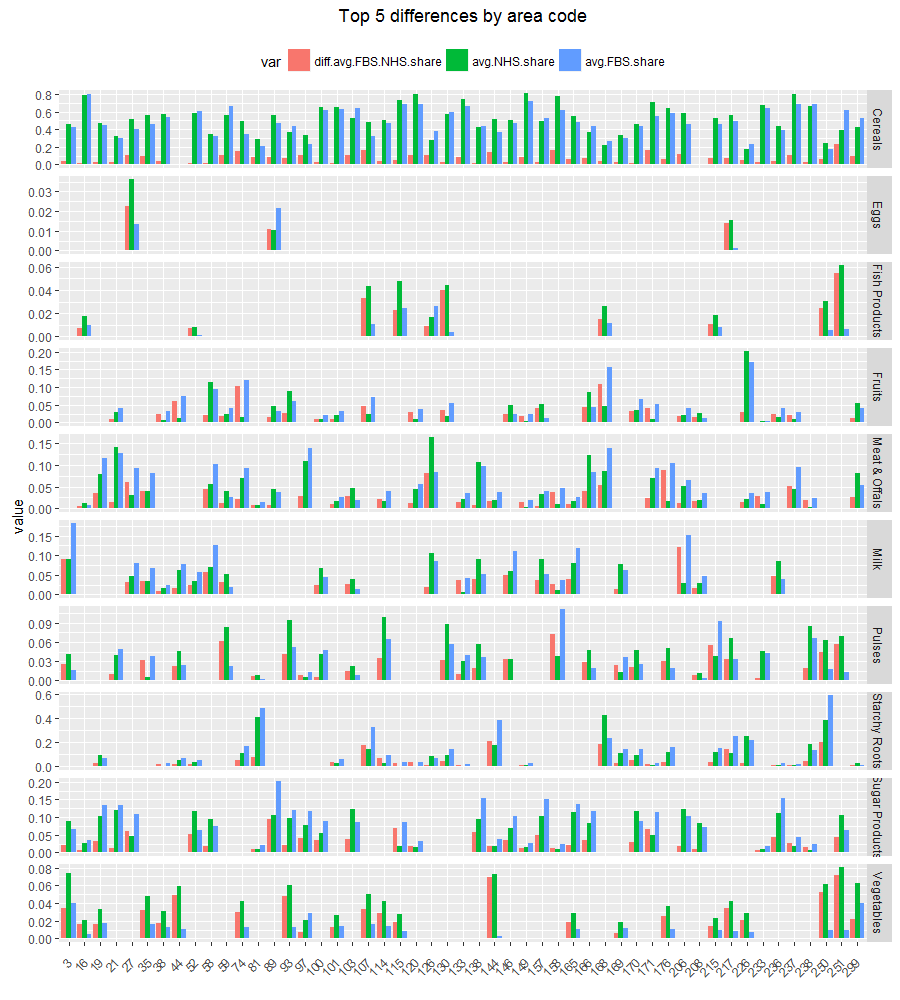
Differences Between FBS and NHS Shares of Food Consumption
Data table provided by Team D:
Data transformation steps:
- calculate average share over 1-3 surveys by areacode
- calculate absolute difference between FBS and NHS shares
- identify top n absolute differences by area code
The plots with n = 1…5 is available at:
FAO Methodology for the Measurement of Food Deprivation
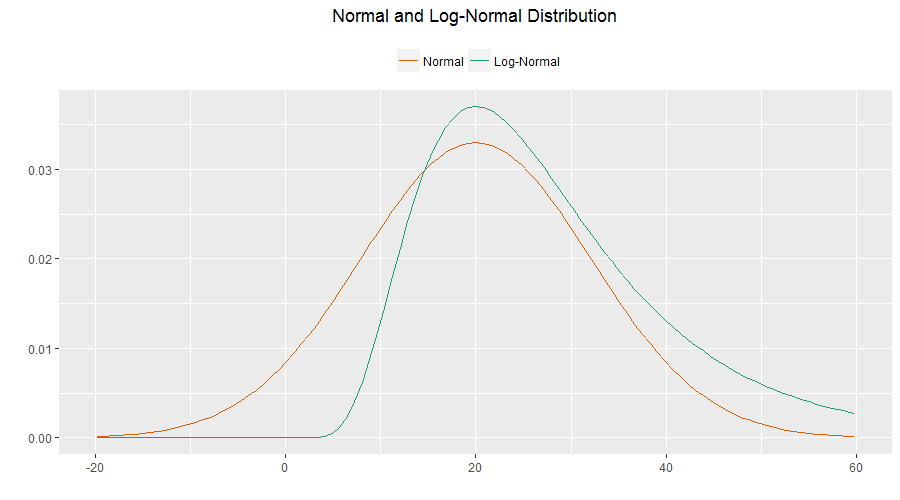
The estimate of the proportion of the population below minimum level of dietary energy consumption has been defined within a probability distribution framework:
\[ P(U) = P \left( x < rL \right) = \int_{x < r_L} f(x)dx = F_{x}(r_L) \]
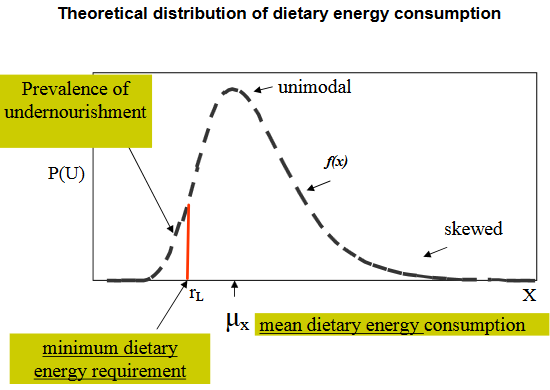
In the graph the curve f(x) depicts the proportion of the population corresponding to different per caput dietary energy consumption levels (x) represented by the horizontal line. The area under the curve up to the minimum energy requirement which is a cut-off point in the curve, r_L, represents the proportion of the population undernourished, i.e. prevalence of undernourishment.
Estimation of the Mean and Coefficient of Variation of the Density Function f(x)
There are two options for estimating the mean: using Food Balance Sheet (FBS) data or Household Budget Survey (HBS) data. The first can be used to prepare annual estimates for monitoring progress in food security for the country as a whole. The second one allows the derivation of sub-national estimates. The latter estimates can not be prepared on a yearly basis, as they depend on the survey frequency, in general ranging from 5 to 10 years. The illustrative results are presented for both options, FBS and HBS.
Dietary Energy Consumption from the Food Balance Sheet (FBS)
The mean is represented by the Dietary Energy Supply per person (DES) which refers to the food available for human consumption during the course of the reference period, expressed in terms of energy (kcal/person/day). The estimate is derived from the Food Balance Sheets compiled on the basis of data on the production (PROD) and trade (IMPorts and EXPorts) of food commodities. Using these data and the available information on stock changes (STCH), losses between the levels at which production is recorded and the household (WASTE) and types of utilization (SEED, FEED, FOOD, inputs for PROCessing derived products and OTHER uses) a supply/utilization account is prepared for each commodity in weight terms. The food component, which is usually derived as a balancing item, refers to the total amount of the commodity available for human consumption during the year. The DES is obtained by aggregating the food component of all commodities after conversion into energy values. The table below presents the standard Food Balance Sheet for the hypothetical country in 1999-2001.
Dietary Energy Consumption from Household Budget Survey
This option requires the conversion of quantities of the different food items consumed by the household into energy values. These data are usually collected through budget surveys using large scale samples which may allow mean estimates not only at the national level but also at sub-national levels such as geographic areas and socio-economic population groups.
Advantages of the use of food consumption estimates from Food Balance Sheets
The procedure of using the daily per person DES derived from the food balance has some advantages as indicated below.
- The FAO daily per person DES database, which covers practically all countries of the world, is regularly revised and up-dated in connection with FAO’s continuous work programme on supply and utilization accounts and food balance sheets. As a result the database represents a readily available source of information for the assessment and monitoring of the prevalence of food deprivation at the global, regional and country levels.
- The linkage of the daily per person DES with a measure of inequality within a probability framework provides a mechanism for assessing the effect of short-term changes in aggregate food availability as well as its components (production, import, etc.) on the distribution of dietary energy consumption and hence the prevalence of food deprivation. In addition, the use of a probability model — such as the log-normal function — facilitates the assessment of expected changes in the prevalence of food deprivation as a result of the combined effect of food supply increase and inequality reduction, as illustrated in the table below.