SUA Module Graph

SUA Module Invalidation
Re-run Trade Module

Re-run Trade and Production Modules
Hold re-run of Food, Stock, Loss and Feed modules until both Trade and Production modules have completed

Re-run Production and Food Modules

Production Module
Flowchart Production Module
yEd file: 2016-06-20-faoswsProduction.graphml

Flowchart Livestock Imputation
Public file: livestock_flow.jpg
yEd file: 2016-06-20-faoswsProduction-livestock.graphml

Stock Module
Flowchart Stock Module
yEd file: 2016-09-05-faoswsStock.graphml
Report AMIS: 2016-05-18-stocks-amis.pdf

- Model based on historical changes
- URL
- file://///HQFILE4/ESS_admin/ESS/Team_working_folder/A/FBS-Methods/OrangeBook/book/6_stocks/Stocks_master.docx
- Label
- Equations 9, 10
- delta stock changes
\Delta \mathsf{S}\_{t-i}(ΔS;) - time
t - numebr of previous stock changes
k - error term
\epsilon_(t)(ε)
\[ \Delta \mathsf{S}_{t} = \beta \left( \sum\limits_{i=1}^{k} \Delta \mathsf{S}_{t-i} \right) + \epsilon_{t}\ \]
We could alternatively express this as
\[ \Delta \mathsf{S}_{t} \sim N \left( \beta \sum\limits_{i=1}^{k} \Delta \mathsf{S}_{t-i} , \sigma^{2} \right) \]
R lm Implementation
The current implementation of the module is different from the Orange Book. The module is using only delta production. The formula currently included in the Orange Book may need to be subject to revision.
  stocksModel <- lm(deltaStocks ~ deltaProduction,
          data = newSuaData[deltaProduction != 0 &
                              deltaStocks != 0])
Tourist Module
Flowchart tourist Module

Model based on historical changes
- URL
- file://///HQFILE4/ESS_admin/ESS/Team_working_folder/A/FBS-Methods/OrangeBook/book/9_Tourists/Tourist%20Consumption_master.docx
- Label
- Equations 23, 24, 25
Calculate total number of tourist days N\_{T}
\[ N_{T} = N_{D} + N_{O} \bar{D} \]
- number of day visitors
N\_{D} - number of overnight visitors
N\_{O} - information on the average number of nights stayed within each country
\bar{D}
Change in amount of food availability for commodity i in country j
\[ \Delta TC_{ij} = - \sum_{k = 1, k \ne j}^{m} N_{jk} f_{ij} + \sum_{l = 1, l \ne j}^{m} N_{lj} f_{il} \]
Suggested alternative notation:
\[ Net TC_{ij} = \sum_{l = 1, l \ne j}^{m} N_{lj} f_{il} - \left( \sum_{k = 1, k \ne j}^{m} N_{jk} \right) * f_{ij} \]
- $N_{lj}$ represents the number of tourists travelling from country $l$ to country $j$
- $f_{il}$ represents the historic amount of daily nutritients consumed within commodity $i$ and in country $l$
- $k$ represents any third country
- $m$ represents the set of possible countries in which tourism can occur
This can be simplified to
\[ \Delta TC_{ij} = - N_{T} f_{ij} + \sum_{l = 1, l \ne j}^{m} N_{lj} f_{il} \]
R module Implementation
The current implementation of the module is different from the Orange Book. […]
touristModel <- lm(...)
Food Module
Compact Flowchart Food Module

Flowchart Food Module

Log-log function
- country $i$
- commodity $j$
- trendfactor $\phi_{i}$
- income elasticity of demand $\epsilon_{ij}$
Per-capita Food Consumption:
\[ \mathsf{FoodPC}_{t,ij} = \mathsf{FoodPC}_{t-1,ij} + e^{\epsilon_{ij} \log \left( \Delta \mathsf{Y}_{t,i} \right) } + \phi_{i} * \mathsf{FoodPC}_{t-1,ij} \]
This corresponds to
\[ \mathsf{FoodPC}_{t,ij} = \left( 1 + \phi_{i} \right) \mathsf{FoodPC}_{t,ij} + e^{\epsilon_{ij} \log \left( \Delta \mathsf{Y}_{t,i} \right) } \]
expanding per-capita food consumption
\[ \mathsf{FoodPC}_{t,ij} = \frac{ \mathsf{Food}_{t,ij} }{ \mathsf{Pop}_{t,i} } \]
\[ \frac{ \mathsf{Food}_{t,ij} }{ \mathsf{Pop}_{t,i} } = \left( 1 + \phi_{i} \right) \frac{ \mathsf{Food}_{t-1,ij} }{ \mathsf{Pop}_{t-1,i} } + e^{\epsilon_{ij} \log \left( \Delta \mathsf{Y}_{t,i} \right) } \]
multiply both sides with $Pop_{t, ij}$
\[ \mathsf{Food}_{t,ij} = \mathsf{Pop}_{t,i} * \left[ \left( 1 + \phi_{i} \right) \frac{ \mathsf{Food}_{t-1,ij} }{ \mathsf{Pop}_{t-1,i} } + e^{\epsilon_{ij} \log \left( \Delta \mathsf{Y}_{t,i} \right) } \right] \]
\[ \mathsf{Food}_{t,ij} = \frac{ \mathsf{Pop}_{t,i} }{ \mathsf{Pop}_{t-1,i} } * \left( 1 + \phi_{i} \right) \mathsf{Food}_{t-1,ij} + \mathsf{Pop}_{t,i} * e^{\epsilon_{ij} \log \left( \Delta \mathsf{Y}_{t,i} \right) } \]
with
\[ \Delta \mathsf{Pop}_{t,i} = \frac{ \mathsf{Pop}_{t,i} }{ \mathsf{Pop}_{t-1,i} } \]
it becomes
\[ \mathsf{Food}_{t,ij} = \Delta \mathsf{Pop}_{t,i} * \left( 1 + \phi_{i} \right) \mathsf{Food}_{t-1,ij} + \mathsf{Pop}_{t,i} * e^{\epsilon_{ij} \log \left( \Delta \mathsf{Y}_{t,i} \right) } \]
where $\Delta Y_{t,i}$ is the per-capita GDP change
\[ \Delta \mathsf{Y}_{t,i} = \frac{ \mathsf{GDPPC}_{t,i} }{ \mathsf{GDPPC}_{t-1,i} } \]
###Linear function
Per-capita Food Consumption: \[ \mathsf{FoodPC}_{t,ij} = \mathsf{FoodPC}_{t-1,ij} + \phi_{i} * \mathsf{FoodPC}_{t-1,ij} \]
This corresponds to
\[ \frac{ \mathsf{Food}_{t,ij} }{ \mathsf{Pop}_{t,i} } = \left( 1 + \phi_{i} \right) \frac{ \mathsf{Food}_{t-1,ij} }{ \mathsf{Pop}_{t-1,i} } \]
multiply both sides with $Pop_{t, ij}$
\[ \mathsf{Food}_{t,ij} = \mathsf{Pop}_{t,i} * \left[ \left( 1 + \phi_{i} \right) \frac{ \mathsf{Food}_{t-1,ij} }{ \mathsf{Pop}_{t-1,i} } \right] \]
\[ \mathsf{Food}_{t,ij} = \frac{ \mathsf{Pop}_{t,i} }{ \mathsf{Pop}_{t-1,i} } * \left( 1 + \phi_{i} \right) { \mathsf{Food}_{t-1,ij} } \]
\[ \mathsf{Food}_{t,ij} = \Delta \mathsf{Pop}_{t,i} * \left( 1 + \phi_{i} \right) \mathsf{Food}_{t-1,ij} \]
Semi-log function
Per-capita Food Consumption:
\[ \mathsf{FoodPC}_{t,ij} = \mathsf{FoodPC}_{t-1,ij} * \left[1 + \epsilon_{ij} \log \left( \Delta \mathsf{Y}_{t,i} \right) \right]+ \phi_{i} * \mathsf{FoodPC}_{t-1,ij} \]
\[ \mathsf{FoodPC}_{t,ij} = \mathsf{FoodPC}_{t-1,ij} * \left[1 + \epsilon_{ij} \log \left( \Delta \mathsf{Y}_{t,i} \right) + \phi_{i} \right] \]
\[ \frac{ \mathsf{Food}_{t,ij} }{ \mathsf{Pop}_{t,i} } = \frac{ \mathsf{Food}_{t-1,ij} }{ \mathsf{Pop}_{t-1,i} } * \left[1 + \epsilon_{ij} \log \left( \Delta \mathsf{Y}_{t,i}\right) + \phi_{i} \right] \]
multiply both sides with $Pop_{t, ij}$
\[\mathsf{Food}_{t,ij} = \frac{ \mathsf{Pop}_{t,i} }{ \mathsf{Pop}_{t-1,i} } * \mathsf{Food}_{t-1,ij} * \left[1 + \epsilon_{ij} \log \left( \Delta \mathsf{Y}_{t,i} \right) + \phi_{i}\right] \]
\[ \mathsf{Food}_{t,ij} = \Delta \mathsf{Pop}_{t,i} * \mathsf{Food}_{t-1,ij} * \left[1 + \epsilon_{ij} \log \left( \Delta \mathsf{Y}_{t,i}\right) + \phi_{i}\right] \]
Log-inverse function
Per-capita Food Consumption:
\[ \mathsf{FoodPC}_{t,ij} = \mathsf{FoodPC}_{t-1,ij} * e^{\epsilon_{ij} \left( 1 - \frac{ \mathsf{1}}{ \Delta \mathsf{Y}_{t,i} } \right)} + \phi_{i} * \mathsf{FoodPC}_{t-1,ij} \]
\[ \mathsf{FoodPC}_{t,ij} = \mathsf{FoodPC}_{t-1,ij} * \left[ e^{\epsilon_{ij} \left( 1 - \frac{ \mathsf{1}}{ \Delta \mathsf{Y}_{t,i} } \right)} + \phi_{i}\right] \]
\[ \frac{ \mathsf{Food}_{t,ij} }{ \mathsf{Pop}_{t,i} } = \frac{ \mathsf{Food}_{t-1,ij} }{ \mathsf{Pop}_{t-1,i} } * \left[ e^{\epsilon_{ij} \left( 1 - \frac{ \mathsf{1}}{ \Delta \mathsf{Y}_{t,i} } \right)} + \phi_{i}\right] \]
multiply both sides with $Pop_{t, ij}$
\[\mathsf{Food}_{t,ij} = \frac{ \mathsf{Pop}_{t,i} }{ \mathsf{Pop}_{t-1,i} } * \mathsf{Food}_{t-1,ij} * \left[ e^{\epsilon_{ij} \left( 1 - \frac{ \mathsf{1}}{ \Delta \mathsf{Y}_{t,i} } \right)} + \phi_{i} \right] \]
\[ \mathsf{Food}_{t,ij} = \Delta \mathsf{Pop}_{t,i} * \mathsf{Food}_{t-1,ij} * \left[ e^{\epsilon_{ij} \left( 1 - \frac{ \mathsf{1}}{ \Delta \mathsf{Y}_{t,i} } \right)} + \phi_{i} \right] \]
Industrial Use Module
Flowchart Industrial Use Module

Feed Module
Loss Module
Flowchart Loss Module
Hierarchical linear model (HLM)
- URL
- file://///HQFILE4/ESS_admin/ESS/Team_working_folder/A/FBS-Methods/OrangeBook/book/11_loss/Loss_master.docx
- Label
- Equation 27a-e
\[ \log \left( \mathsf{Loss}_{ijklm} \right) = \alpha_{1} t + \alpha_{2ijkl} \log \left( \mathsf{Production}_{ijklm} + 1 \right) + \mathsf{A}_{ijklm} \]
\[ \alpha_{2ijkl} = \beta_{20} + \beta_{2ijk} \left( \mathsf{Country:Commodity} \right)_{ijkl} + \mathsf{B}_{ijkl} \]
\[ \beta_{2ijk} = \gamma_{20} + \gamma_{2ij} \left( \mathsf{Commodity} \right) + \mathsf{C}_ijk \]
\[ \gamma_{2ij} = \delta_{20} + \delta_{2i} \left( \mathsf{Food Group} \right) + D_{ij} \]
\[ \delta_{2i} = \zeta_{20} + \zeta_{21} \left( \mathsf{Food Perishable Group}_{i} \right) + \mathsf{E}_{i} \]
R lme4 Implementation
The current implementation of the module is different from the Orange Book. The module includes imports (measuredElementTrade_5610). The formula currently included in the Orange Book may need to be subject to revision.
  lossLmeModel =
    lmer(log(Value_measuredElement_5016 + 1) ~
           -1 +
           timePointYears +
           log(Value_measuredElement_5510 + 1) +
           (-1 + log(Value_measuredElement_5510 + 1)|
            foodPerishableGroup/foodGroupName/measuredItemCPC/geographicAreaM49)+
           log(Value_measuredElementTrade_5610 + 1) +
           (-1 + log(Value_measuredElementTrade_5610 + 1)|
            measuredItemCPC/geographicAreaM49),
         data = finalModelData)

git repository on network share
- monitor suggested changes (e.g. foodPerishableGroup.csv)
- use as development environment
- consider for integration with repository used by SWS
Configuration
git remote add upstream https://github.com/SWS-Methodology/faoswsLoss.git
git remote set-url origin file://t:/Team_working_folder/A/FBS-Modules/faoswsLoss/.git
Seed Module
Trade Module
Outlier Detection in “Complete Trade Flow” Module
- currently, only the data for 2011 is considered
- the result has been created using the validate package
- values are categorized as outliers according to their unit value
uv = value / qty - on the y-axis, the ratio of observations categorized as “outliers” is shown
- for example if the “outlier coefficient” is set to the value 1.5 (x-axis), this results in 6.4% of the observations to be considered as “outliers” (y-axis)
- the variable
qtyis a combined result of weight (mass) and supplementary quantity measures and represents an item measured in metric tons - for values that are considered as outliers, the weight is calculated as
qty = value / uvwhereuvrepresents the median unit value for each reporter - observations where the weight is re-calculated receive the
flagObservationStatus = IandflagMethod = e
Sensitivity of outlier to coefficient
coefargument ofboxplot.statsR function ingrDevices- determines how far the plot ‘whiskers’ extend out from the box. If
coefis positive, the whiskers extend to the most extreme data point which is no more thancoeftimes the length of the box away from the box. A value of zero causes the whiskers to extend to the data extremes (and no outliers be returned). The default value forcoefis 1.5. The interquartile range IQR corresponds to the length of the box, i.e. the difference between Q1 and Q3.

Source: https://en.wikipedia.org/wiki/Box_plot#/media/File:Boxplot_vs_PDF.svg
faoswsTrade/modules/complete_tf_cpc/main.R
# Outlier detection

tradedata <- tradedata %>%
  group_by_(~year, ~reporter, ~flow, ~hs) %>%
  mutate_(
    uv_reporter = ~median(uv, na.rm = T),
    outlier = ~uv %in% boxplot.stats(uv, coef = out_coef, do.conf = F)$out) %>%
  ungroup()
Adjustment Notes applied to Comtrade
Example rows from the adjustments SWS datatable
| year | flow | hs | fcl | partner | weight | qty | value | special | reporter |
|---|---|---|---|---|---|---|---|---|---|
| 2012 | 1 | NA | 17 | NA | 10 | NA | NA | NA | 8 |
| 2005 | 2 | NA | 1168 | NA | 100 | NA | NA | NA | 11 |
| NA | NA | NA | 836 | NA | 0.6 | NA | NA | NA | 52 |
| 2013 | 4 | NA | 702 | 194 | 0.1 | NA | NA | NA | 13 |
| 2011 | 1 | NA | 1061 | NA | 0.1 | NA | NA | NA | 37 |
| 2013 | 2 | 9030000 | 671 | 231 | 10 | NA | NA | NA | 33 |
The table below shows combinations of flow, hs, partner and reporter dimensions with n >= 10 occurences. For each of these combinations, the relevant rows have been extracted from the adjustments table and sorted by year in ascending order.
| rowname | flow | hs | partner | reporter | count |
|---|---|---|---|---|---|
| 1 | 1 | 4041048 | 67 | 210 | 13 |
| 2 | 2 | 8051000 | 114 | 215 | 11 |
| 3 | 1 | 15220099 | 68 | 150 | 10 |
| 4 | 2 | 22019000 | 106 | 198 | 10 |
[[1]]
| year | flow | hs | fcl | partner | weight | qty | value | special | reporter |
|---|---|---|---|---|---|---|---|---|---|
| 1999 | 1 | 4041048 | NA | 67 | 0.01 | NA | NA | NA | 210 |
| 2001 | 1 | 4041048 | 890 | 67 | 0.01 | NA | NA | NA | 210 |
| 2002 | 1 | 4041048 | 890 | 67 | 0.01 | NA | NA | NA | 210 |
| 2003 | 1 | 4041048 | 890 | 67 | 0.01 | NA | NA | NA | 210 |
| 2004 | 1 | 4041048 | 890 | 67 | 0.01 | NA | NA | NA | 210 |
| 2006 | 1 | 4041048 | 890 | 67 | 0.01 | NA | NA | NA | 210 |
| 2007 | 1 | 4041048 | 890 | 67 | 0.01 | NA | NA | NA | 210 |
| 2008 | 1 | 4041048 | 890 | 67 | 0.01 | NA | NA | NA | 210 |
| 2009 | 1 | 4041048 | 890 | 67 | 0.01 | NA | NA | NA | 210 |
| 2010 | 1 | 4041048 | 890 | 67 | 0.01 | NA | NA | NA | 210 |
| 2011 | 1 | 4041048 | 890 | 67 | 0.01 | NA | NA | NA | 210 |
| 2012 | 1 | 4041048 | 890 | 67 | 0.01 | NA | NA | NA | 210 |
| 2013 | 1 | 4041048 | 890 | 67 | 0.01 | NA | NA | NA | 210 |
[[2]]
| year | flow | hs | fcl | partner | weight | qty | value | special | reporter |
|---|---|---|---|---|---|---|---|---|---|
| 1997 | 2 | 8051000 | 490 | 114 | 0.1 | NA | NA | NA | 215 |
| 2000 | 2 | 8051000 | 490 | 114 | 0.1 | NA | NA | NA | 215 |
| 2001 | 2 | 8051000 | 490 | 114 | 0.1 | NA | NA | NA | 215 |
| 2002 | 2 | 8051000 | 490 | 114 | 0.1 | NA | NA | NA | 215 |
| 2003 | 2 | 8051000 | 490 | 114 | 0.1 | NA | NA | NA | 215 |
| 2004 | 2 | 8051000 | 490 | 114 | 0.1 | NA | NA | NA | 215 |
| 2005 | 2 | 8051000 | 490 | 114 | 0.1 | NA | NA | NA | 215 |
| 2006 | 2 | 8051000 | 490 | 114 | 0.1 | NA | NA | NA | 215 |
| 2007 | 2 | 8051000 | 490 | 114 | 0.1 | NA | NA | NA | 215 |
| 2009 | 2 | 8051000 | 490 | 114 | 0.1 | NA | NA | NA | 215 |
| 2012 | 2 | 8051000 | 490 | 114 | 10 | NA | NA | NA | 215 |
[[3]]
| year | flow | hs | fcl | partner | weight | qty | value | special | reporter |
|---|---|---|---|---|---|---|---|---|---|
| 1999 | 1 | 15220099 | NA | 68 | 0.1 | NA | NA | NA | 150 |
| 2000 | 1 | 15220099 | 1277 | 68 | 0.1 | NA | NA | NA | 150 |
| 2007 | 1 | 15220099 | 1277 | 68 | NA | NA | weight | NA | 150 |
| 2008 | 1 | 15220099 | 1277 | 68 | NA | NA | weight | NA | 150 |
| 2009 | 1 | 15220099 | 1277 | 68 | NA | NA | m570 | NA | 150 |
| 2010 | 1 | 15220099 | 1277 | 68 | 0.01 | NA | NA | NA | 150 |
| 2010 | 1 | 15220099 | 1277 | 68 | NA | NA | weight | NA | 150 |
| 2011 | 1 | 15220099 | NA | 68 | f0 | NA | NA | NA | 150 |
| 2012 | 1 | 15220099 | 1277 | 68 | NA | NA | weight | NA | 150 |
| 2013 | 1 | 15220099 | 1277 | 68 | NA | NA | m1000 | NA | 150 |
[[4]]
| year | flow | hs | fcl | partner | weight | qty | value | special | reporter |
|---|---|---|---|---|---|---|---|---|---|
| 2004 | 2 | 22019000 | 631 | 106 | 0.01 | NA | NA | NA | 198 |
| 2005 | 2 | 22019000 | 631 | 106 | 0.001 | NA | NA | NA | 198 |
| 2006 | 2 | 22019000 | 631 | 106 | 0.01 | NA | NA | NA | 198 |
| 2007 | 2 | 22019000 | 631 | 106 | 0.001 | NA | NA | NA | 198 |
| 2008 | 2 | 22019000 | 631 | 106 | 0.01 | NA | NA | NA | 198 |
| 2009 | 2 | 22019000 | 631 | 106 | 0.001 | NA | NA | NA | 198 |
| 2010 | 2 | 22019000 | 631 | 106 | 0.001 | NA | NA | NA | 198 |
| 2011 | 2 | 22019000 | 631 | 106 | 0.01 | NA | NA | NA | 198 |
| 2012 | 2 | 22019000 | 631 | 106 | 0.001 | NA | NA | NA | 198 |
| 2013 | 2 | 22019000 | 631 | 106 | 0.01 | NA | NA | NA | 198 |
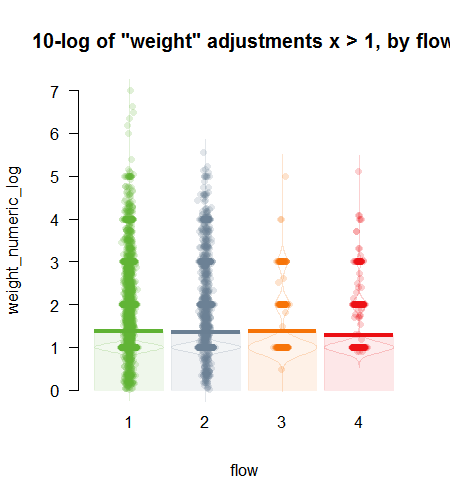
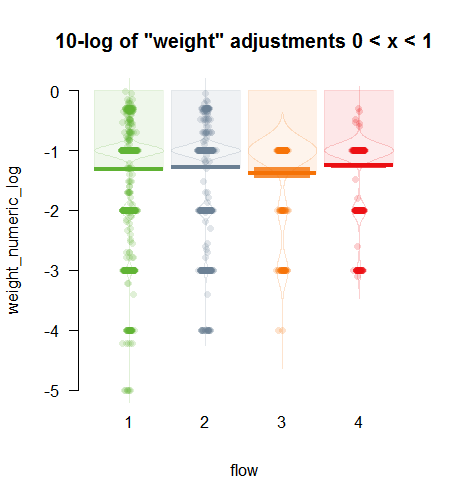
Characters preceeding numeric weights and character weights
## [1] "f" "m" "o" "qty" "value" "weight"Distribution of numeric weights
## smaller than one
adjustments_list[["weight"]][["numeric"]] %>% .[. < 1] %>% base::summary()
## Min. 1st Qu. Median Mean 3rd Qu. Max.
## 0.0000 0.0100 0.1000 0.2082 0.3667 0.9800## larger than or equal to one
adjustments_list[["weight"]][["numeric"]] %>% .[. >= 1] %>% base::summary()## Min. 1st Qu. Median Mean 3rd Qu. Max.
## 1 16 91 19440 711 10000000Visual display of numeric weight distribution by type of trade flow. Log values are shown for better display.
Based on the filter in the module, two files have been prepared
adjustments = adjustments %>%
  filter_(~!(is.na(year) &
               weight == 1000))
- 1726 observations where
weightis equal to1000: adjustments_weigth1000.csv - 1599 observations where
weightis equal to1000andyearis specified: adjustments_weigth1000_year.csv
I.e. there are only 127 out of the 1726 observations where no year is specified. This corresponds to 7.3 % of the observations.
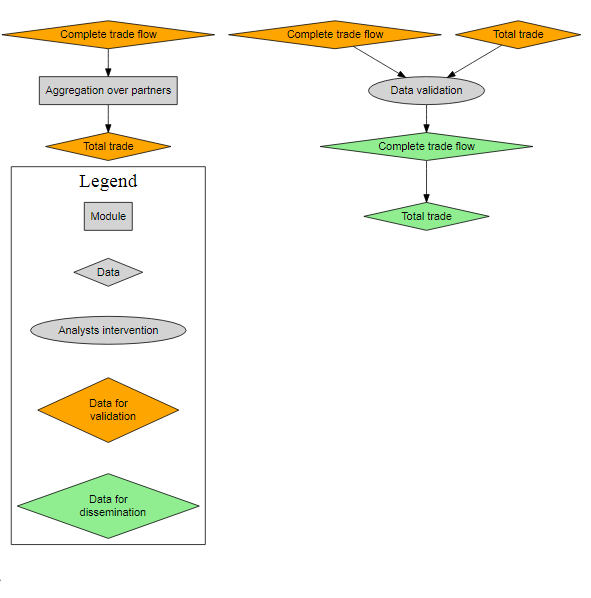
Flowchart Trade Module
Raw Data Transformation
SWS-Methodology/faoswsTrade/vignettes/Documentation/assets/trade_1.png
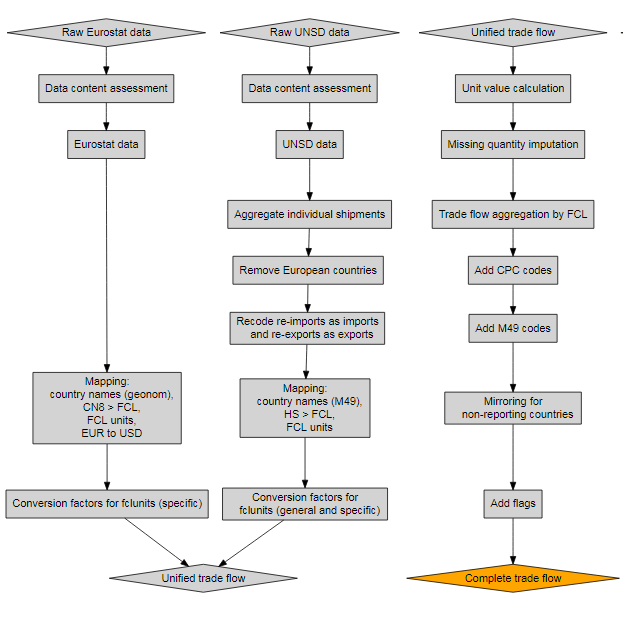
Imputation and Aggregation
SWS-Methodology/faoswsTrade/vignettes/Documentation/assets/trade_2.png
Standardization Module
Flowchart Standardization Module

Imputation Module
Balancing Module
Flag Module
Util Module
Modules Module
GitHub Issues by Repository
faoswsFeed
faoswsFood
faoswsIndustrial
faoswsLoss
faoswsProduction
faoswsSeed
faoswsStandardization
Add intermediate save to balanceResidual
- When module compiles unbalanced SUA, it should create an element which is the availability in the crude balancing step. This can be done as a SaveData call in balanceResidual. Probably to the sua table?
Incomplete extraction rates and shares
- I’m fairly sure that these tables are incomplete. They come from the
aupus_ratiotable - I need to check their status.
Nutritive factors seem missing
- We currently have no calorie/protein/fat factors for wheat flour (across all countries and all years). Clearly we must be missing some data…
Specify food/feed/industrial/… commodities
- In the standardization process, the balanceResidual function will balance the SUA level commodities by assigning imbalances to a specific variable. For example, if the balance for flour has an excess of 5,000 tons, this amount will be added to the food of flour (while for bran it would be allocated to feed). We need to implement the list specifying what variable certain commodities get allocated to (food, feed, industrial uses, etc.) and incorporate this information into the balanceResidual function.
faoswsStock
faoswsTourist
faoswsTrade
EU Commission - Combined Nomenclature table for 1999-2008
- Currently, the Datatables don’t seem to be on the working system.
Key not found for dimension measuredItemCPC
- There are a number of CPC codes that aren’t in the destination table for Total trade. I’m not sure as to why that is, but among them are
01241.90,01919.96and21419.91.
Issues PDF by Repository
- The following links can be accessed after logging in to hostedredmine.com
- user:
faoessatest
login:5udSPY57
-
Stocks stocks-module/issues.pdf
-
Tourist tourist-module/issues.pdf
-
Industrial Use industrial-use/issues.pdf
Sub-Modules by Package
Each of the subfolders in /modules is supposed to contain a main.R and a metadata.xml file
 faoswsFeed
:   impute_feed

faoswsFood
:   food_input_validation
    impute_food

faoswsIndustrial
:   impute_industrial

faoswsLoss
:   impute_loss
    loss_input_validation

faoswsProduction
:   balance_production_identity
    impute_livestock
    impute_non_livestock
    production_input_validation
    status_report

faoswsSeed
:   seed_imputation
    seed_input_validation

faoswsStandardization
:   pullDataToSUA
    standardization

faoswsStock
:   impute_stocks

faoswsTourist
:   impute_tourist

faoswsTrade
:   complete_tf_cpc
    total_trade_CPC
R Scripts by Package
 faoswsFeed
:   animalFunctions.R
    ass_energy_factor.r
    ass_protein_factor.r
    buffalo_energy_factor.r
    buffalo_protein_factor.r
    calculateAnimalUnits.R
    calculateAquaDemand.r
    calculateFeedDemand.R
    calculateIR.R
    calculateLivestockDensity.R
    camel_energy_factor.r
    camel_protein_factor.r
    cattle_energy_factor.r
    cattle_protein_factor.r
    chicken_energy_factor.r
    chicken_protein_factor.r
    data.R
    duck_energy_factor.r
    duck_protein_factor.r
    faoswsFeed-package.R
    feedAvail.R
    getAnimalStocks.R
    getQueryKey.R
    goat_energy_factor.r
    goat_protein_factor.r
    goose_energy_factor.r
    goose_protein_factor.r
    horse_energy_factor.r
    horse_protein_factor.r
    mule_energy_factor.r
    mule_protein_factor.r
    optimizeFeed.R
    pig_energy_factor.r
    pig_protein_factor.r
    rabbit_energy_factor.r
    rabbit_protein_factor.r
    sheep_energy_factor.r
    sheep_protein_factor.r
    turkey_energy_factor.r
    turkey_protein_factor.r

faoswsFood
:   calculateFood.R
    commodity2FunctionalForm.R
    FoodModule.R
    functionalForms.R
    getCommodityClassification.R
    getFoodData.R

faoswsIndustrial
:

faoswsLoss
:   addHeadingsFCL.R
    faoswsLoss-package.R
    getImportData.R
    getLossData.R
    getLossFoodGroup.R
    getProductionData.R
    getSelectedLossData.R
    imputeLoss.R
    mergeAllLossData.R
    removeCarryLoss.R
    requiredItems.R
    saveImputedLoss.R

faoswsProduction
:   balanceAreaHarvested.R
    balanceProduction.R
    balanceProductionTriplet.R
    computeYield.R
    ensureProductionInputs.R
    ensureProductionOutputs.R
    expandMeatSessionSelection.R
    faoswsProduction-package.R
    getAllHistory.R
    getAllYieldKey.R
    getAnimalMeatMapping.R
    getImputationParameters.R
    getProductionData.R
    getProductionFormula.R
    getYieldData.R
    imputeProductionTriplet.R
    isPrimary.R
    nonImputationItems.R
    okrapd.R
    processProductionDomain.R
    productionFormulaParameters.R
    productionProcessingParameters.R
    selectImputationItem.R
    selectMeatCodes.R
    transferParentToChild.R

faoswsSeed
:   areaRemoveZeroConflict.R
    buildCPCHierarchy.R
    ensureNoConflictingAreaSownHarvested.R
    faoswsSeed-package.R
    fillCountrySpecificSeedRate.R
    fillGeneralSeedRate.R
    getAllAreaData.R
    getAllCountries.R
    getAllItemCPC.R
    getAllYears.R
    getAreaData.R
    getCountryGeneralSeedRate.R
    getCountrySpecificSeedRate.R
    getOfficialSeedData.R
    getSelectedSeedData.R
    getWorldBankClimateData.R
    imputeAreaSown.R
    mergeAllSeedData.R
    removeCarryForward.R
    removeManualEstimation.R
    saveSeedData.R
    seedData.R

faoswsStandardization
:   addMissingElements.R
    adjustCommodityTree.R
    balanceResidual.R
    calculateAvailability.R
    collapseEdges.R
    computeFbsAggregate.R
    defaultStandardizationParameters.R
    elementCodesToNames.R
    elementNamesToCodes.R
    faoswsStandardization-package.R
    fbsTree.R
    finalStandardizationToPrimary.R
    findProcessingLevel.R
    getFBSTree.R
    getOldCommodityTree.R
    mapCommodityTree.R
    markUpdated.R
    plotCommodityTrees.R
    plotSingleTree.R
    printSUATable.R
    processForward.R
    standardizationWrapper.R
    standardizeTree.R
    usaWheat.R

faoswsStock
:   getAllCountries.R
    getProductionData.R
    getStockData.R
    getStocksCPC.R
    getTotalTradeData.R

faoswsTourist
:   getAllCountries.R
    getAllItemCPC.R
    getCommodityClassification.R
    getFoodConsumption.R
    getNutrientConversionFactor.R

faoswsTrade
:   applyadj.R
    convertComtradeM49ToFAO.R
    convertGeonom2FAO.R
    convertHS2FCL.R
    convertMeasuredElementTrade.R
    convertTLPartnerToFAO.R
    data.R
    descFCL.R
    faoAreaName.R
    getAgriHSCodes.R
    getAllItems.R
    getlistofadjs.R
    hsInRange.R
    is.SWSEnvir.R
    trailingDigits.R
    trailingDigits2.R
    verifyTarifflinePartners.R